

Updated · Originally published
Analysis mode in is a standout feature among the platform’s ongoing updates, focused on breaking down data in a new way. Introduced in the spring , embedded analysis mode promises to significantly enhance the daily operations and efficiency of power users.
For us at Cosmos, who thrive on Business Central reporting and data, analysis mode presents a prime opportunity to explore and innovate. In this article, we’ll dissect the analysis mode feature in Business Central—its functions, benefits, potential use cases, and how it stands up against popular enhanced or third-party reporting tools like Cosmos.
Understanding Business Central Analysis Mode
Analysis mode in Business Central should not be confused with Analysis Views or Financial Reports (formerly known as Account Schedules), which are the primary tools for creating user-defined financial statements and queries across global dimensions. Instead, analysis mode offers a straightforward, if rudimentary, PivotTable-like experience directly within Business Central.
Although it may sound basic, this feature is surprisingly useful in practice. When you activate analysis mode by clicking on 'Analyze' from any list page, a PivotTable-like grid appears on the right side of the screen, automatically grouping data according to default settings. For instance, if you are on the Customers page and select 'Analyze,' the system shifts into 'Pivot mode,' allowing you to adjust the fields, rows, columns, and value options to suit your analysis needs. During our testing in the Cronus database, it defaulted to grouping by Responsibility Center without a clear explanation, though changing this setting was easily accomplished.

It's important to note that analysis mode is limited to the fields available on the current page. For example, if you wanted to group data by 'Salesperson,' you would be unable to do so unless that field is present on the page being analyzed.
There are also instances where analysis mode might not be available on pages where it would be expected, like the Chart of Accounts. However, it is typically accessible on most common pages such as GL Entries, offering alternative ways to access and analyze information.
If you start analysis mode from the GL Entries page, for example, you can group rows by GL Account or Customer Group Code and arrange columns by posting month. Even though it's not possible to access the GL Account Name from this view, the setup still serves as a functional querying tool.
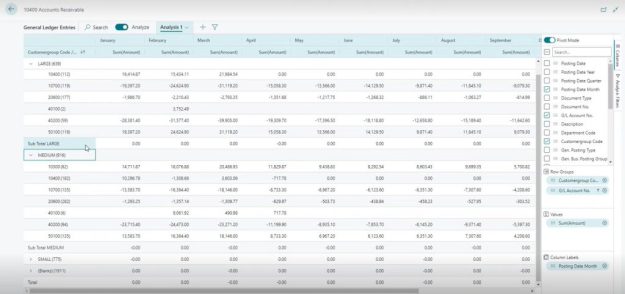
You can save any analysis mode templates you create for later use, although these cannot be shared with others, including fellow Business Central users in your organization.
With this understanding, you can now effectively apply the new analysis mode feature to enhance your data interaction within Business Central.
Analysis Mode Applications and Constraints
Analysis mode is primarily designed for Business Central power users to swiftly answer straightforward queries directly within the application, without the need to export data to Excel, navigate away from the app, or generate custom reports for basic inquiries. It represents a significant enhancement to the user experience within Business Central itself. However, it is not intended for comprehensive operational reporting, financial analysis, data management, or collaborative efforts.
Here is an overview of its key features and limitations:
Functionalities of Business Central Analysis Mode:
- Enables quick, PivotTable-style queries across most pages in Business Central.
- Allows grouping of data by available fields to display subtotals and other values.
- Integrates data from third-party applications that add data to Business Central pages, making it accessible in analysis mode.
- Facilitates data summarization according to a specified hierarchical structure.
- Permits the duplication and creation of multiple tabs to show alternative data views for various analytical needs.
- Allows users to save their analysis setups for later personal use.
- Enhances the capability to access specific data details within Business Central without exiting the application.
- Typical use cases include monitoring newly added vendors, examining sales statistics, and tracking follow-up tasks.
Limitations of Business Central Analysis Mode:
- Ineffective with datasets exceeding 100,000 rows—although Microsoft plans to potentially expand this limit to 500,000 rows in the future.
- Unable to incorporate data or fields not present on the active page.
- Lacks functionalities for charting or graphical representation.
- Does not offer an option to export data to Excel.
- Lists fields in Pivot mode in a randomized, non-alphabetical order, which can complicate data retrieval.
- Does not support data sharing or collaborative use.
- Unsuitable for detailed financial or operational reporting.
- Performance may degrade in a web browser with larger datasets as all transactions need to be loaded into the browser to be functional.
Cosmos vs. Analysis Mode
Microsoft's documentation clearly states that the new analysis mode in Business Central is not intended to replace 'Excel, Power BI, or other [third-party] data analysis applications.' It's important to understand that the analyze feature in Business Central isn't designed to perform the same functions as ' advanced reporting and analytics solutions. In fact, comparing the two can feel like comparing apples to oranges. However, with Microsoft regularly introducing new reporting and analytics features, it naturally leads to queries from both solution delivery partners and users about how these new tools differ from existing solutions like Cosmos.
The purpose of embedded analysis mode is to offer a fresh, enhanced method for interacting with data on list pages within Business Central. It allows users to group, filter, and summarize available data on a page, like using a PivotTable in Excel, to quickly answer questions based on the information visible from that view. Users can save their pivoted queries for future reference. However, this mode does not support graphing, sharing, or merging data from multiple tables.
In contrast, Cosmos is a comprehensive, fast, and platform, uniquely designed for Business Central. It is the only genuine cloud reporting platform tailored specifically for Business Central, enabling users to create any operational report, financial statement, or dashboard swiftly and effectively in their preferred format, either directly in Excel or Power BI.
Operating entirely from a centralized cloud platform (i.e., serverless), Cosmos offers all the benefits of a traditional data warehouse—speed, an optimized data model, unlimited data combinations, easy access to data, and seamless integration with third-party Business Central applications—without the hefty cost or extensive overhead.
You can see a chart below that provides a side-by-side comparison of these two options. While not a comprehensive list of Cosmos' capabilities, this comparison might help you quickly gauge the differences between the new Business Central feature and Cosmos.

Take Your Business Central Reporting and Analytics to the Next Level
There's industry speculation that the development of the analysis mode feature was driven by the desire to bolster Business Central’s position in the broader market by adding more user-focused, application-embedded analytics features.
Interestingly, Microsoft already excels in two significant areas within the competitive cloud business applications market: they offer one of the most trusted and widely adopted visual BI platforms with Power BI, and they provide the broadest range of superior, third-party reporting integrations, including solutions like Cosmos.
The quick ad hoc data pivoting provided by the new analysis mode can indeed be quite useful. However, if past trends are any indication, the major breakthroughs in reporting and analytics for Business Central are unlikely to originate from features directly built into the ERP applications. Rather, the future of reporting is poised to emerge from innovative, dedicated add-ons specifically designed for the Business Central cloud environment, to enable users to harness its extensive visualization capabilities without needing expertise in SQL, DAX, or other technical skills.
That's precisely the rationale behind the creation of Cosmos! As the uptake of Business Central cloud continues to surge annually, a clear gap became evident for —the need for reporting tools that could adapt not only to Business Central but also surpass the capabilities of on-premise tools developed for other ERP systems. These older solutions often fall short in performance, speed, flexibility, and user-friendliness, which are crucial for businesses relying on Business Central to drive efficiency and growth.
Cosmos addresses these needs by providing rapid, comprehensive reporting capabilities across all your Business Central data and applications, centralized in a user-friendly platform, accessible via the familiar environments of Excel or Power BI.
Interested in seeing how it works? Let us show you how to implement Cosmos in under 30 minutes and get 30 easily customizable Business Central reports up and running the same day.