

|
Manufacturing Insights for Dynamics 365 BCPower BI Manufacturing Reporting for Dynamics 365 BC |
Product Verticals: All Industries
Business Processes: Business Intelligence, Inventory Management, Reporting
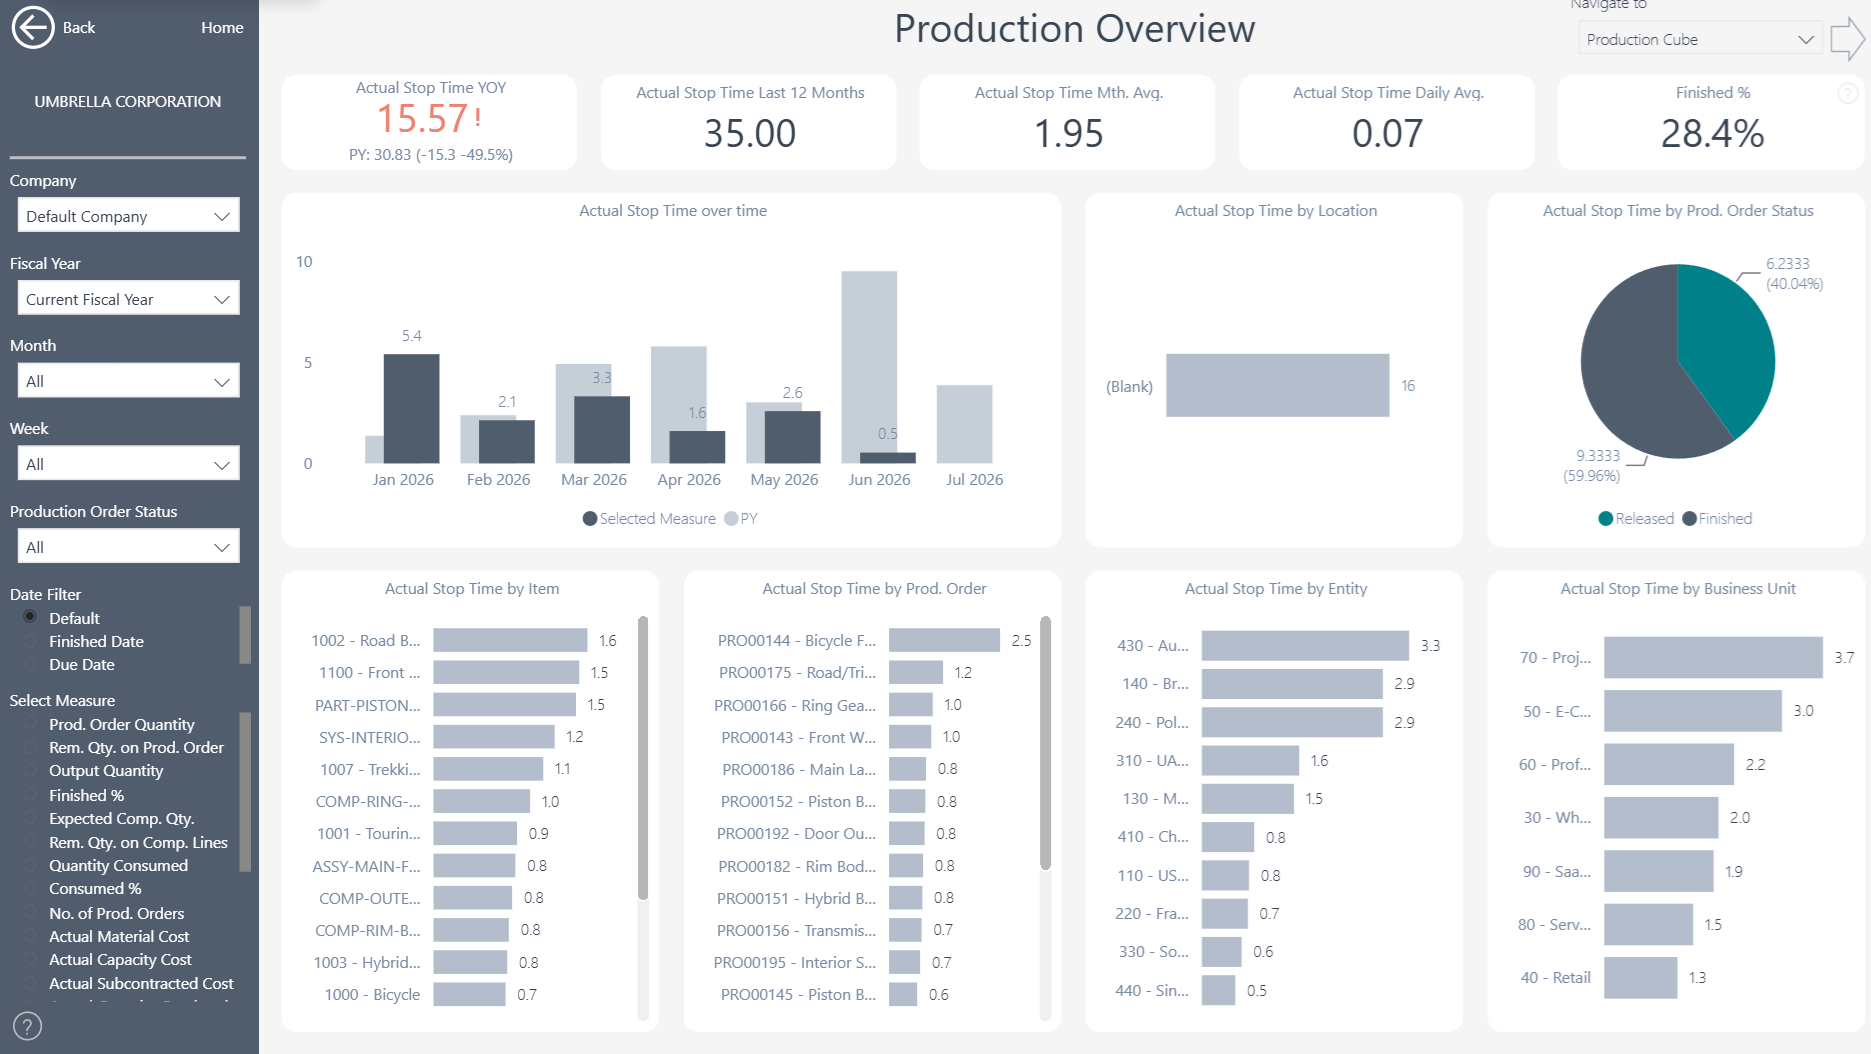
Manufacturing Insights gives Microsoft Dynamics 365 Business Central users 30+ ready-to-use Power BI reports. In addition, it gives production and finance teams a detailed view of output, consumption, costs, capacity, and delivery performance.
 |
 |
Power BI Manufacturing Reporting for Business Central
Bring production information together in clear dashboards that support faster operational decisions. Review production orders, monitor delivery performance and investigate cost, quantity or timing variances.
What You Can Analyze
Analyze production performance, delivery, costs and capacity through one consistent reporting model. More than 100 measures and 40 dimensions allow users to investigate results across production orders, items, machine centers, work centers and other relevant areas.
- Production overview and performance by dimension
- On-time and in-full production
- Routing Gantt charts
- Production costs and cost variances
- Capacity overview
- Actual versus expected capacity
- Material, capacity, subcontracting and overhead costs
Compare Expected and Actual Production
Compare expected quantities, costs, run times and setup times with actual results. For example, cost-variance reports help teams identify whether materials, capacity, subcontracting or overhead caused a difference. On-time and in-full measures also show whether production meets delivery expectations. By combining these results with output and consumption analysis, teams can focus improvement work on the orders and products with the greatest impact.
Control Production, Cost, and Capacity
See whether production is running to plan and identify orders that require attention. Teams can compare output, consumption, costs and delivery performance across products, production orders and periods. This clearer view helps operations and finance teams investigate variances earlier. It also provides consistent information for production reviews and cost-control decisions.
Use Capacity More Effectively
Capacity dashboards help managers understand workloads across machine centers and work centers. Meanwhile, routing Gantt charts provide a visual view of production timing and sequence. Users can compare expected and actual run times, setup times and capacity requirements. As a result, teams can identify potential constraints and make more informed scheduling and resource decisions.
Multi-Company and Flexible Analysis
Bring manufacturing information from multiple Business Central companies into one reporting view. Users can then filter and compare results by company, date, location, item, production order, machine center, work center and other relevant dimensions. At the same time, the consolidated view preserves access to individual companies, production orders and source transactions.
Reporting Without Custom Development
The ready-to-use Power BI app connects directly to Microsoft Dynamics 365 Business Central. This means operations and finance teams can start with proven reports instead of building every dashboard from scratch. Teams can also use the underlying semantic model to create additional Power BI reports or analyze trusted Business Central data in Microsoft Excel. In this way, the app provides a flexible reporting foundation without requiring extensive custom development.
Explore Manufacturing Insights
Learn more about , review current , or book a tailored .
Ready to explore your own Business Central manufacturing data? Start a .
Submit your review | |