

|
Projects Insights for Dynamics 365 BCPower BI Project Reporting for Dynamics 365 BC |
Product Verticals: All Industries
Business Processes: Business Intelligence, Financial Reporting, Project Management, Reporting
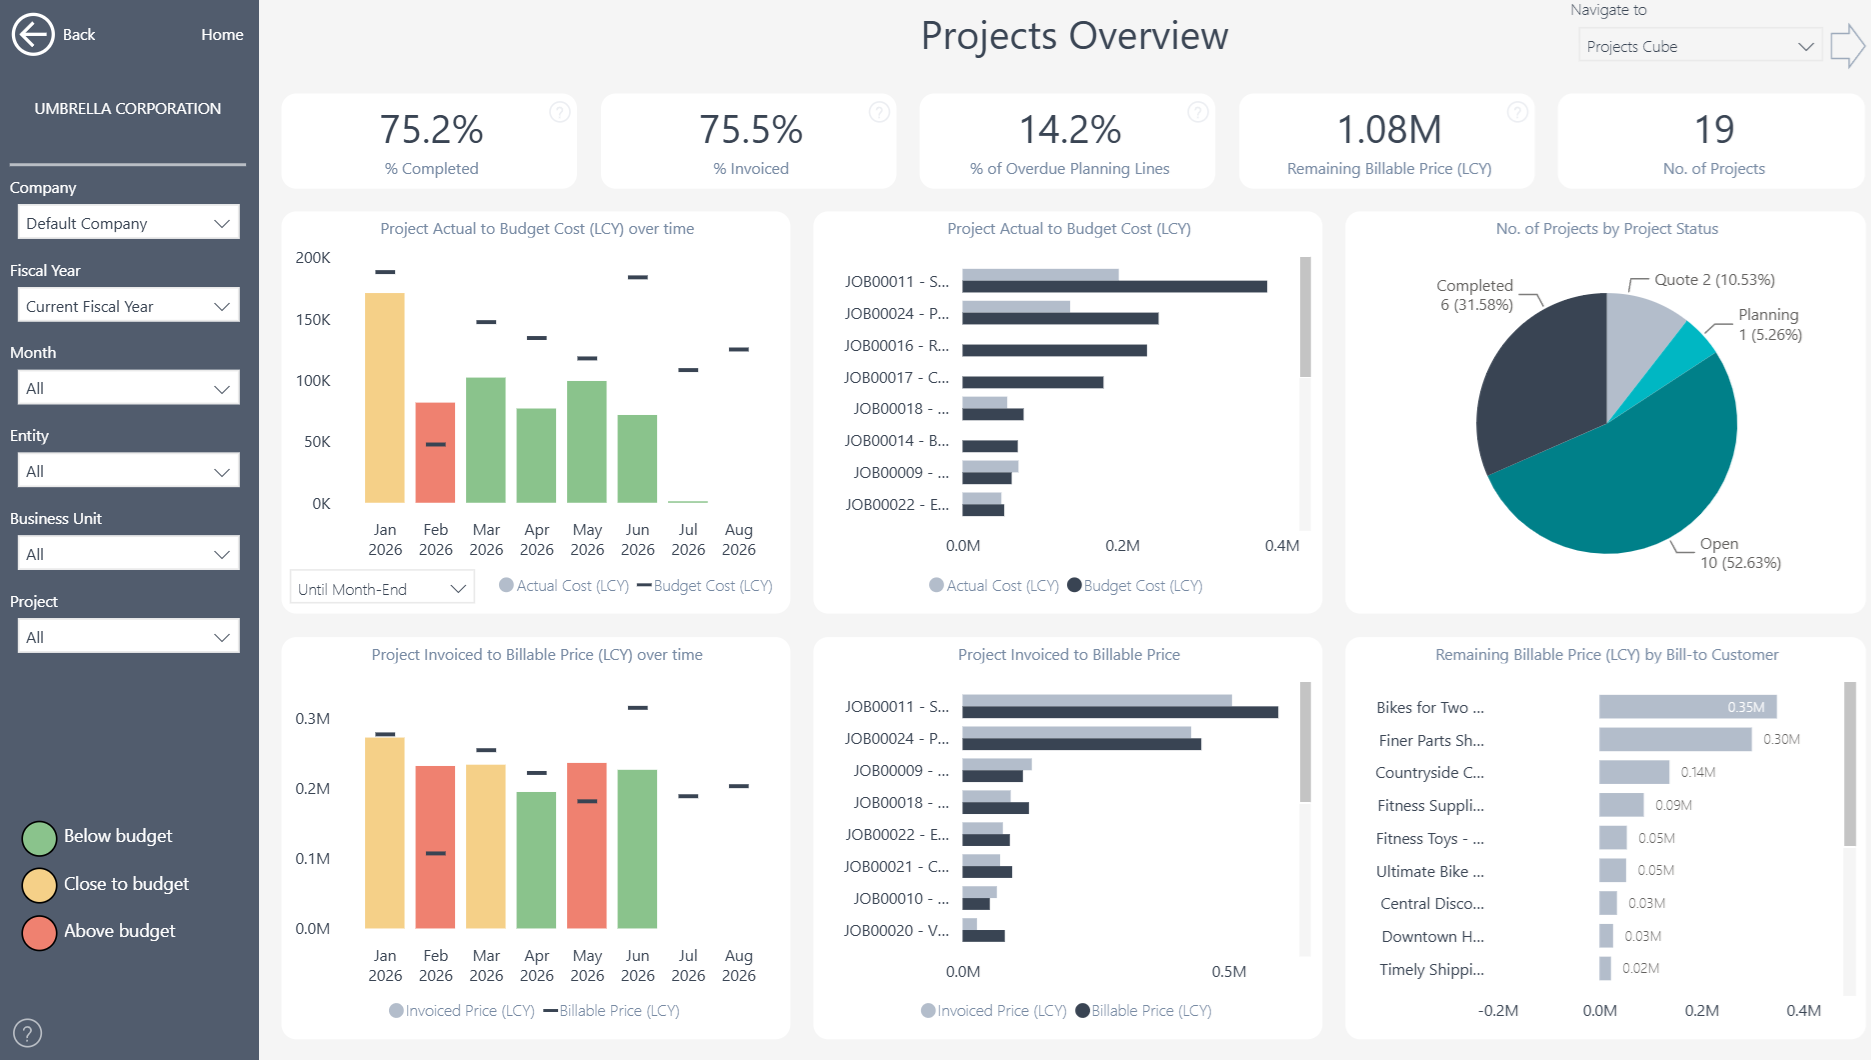
Projects Insights gives Microsoft Dynamics 365 Business Central users 15+ ready-to-use Power BI reports. In addition, it gives project managers and finance teams a shared view of performance, budgets, costs, profitability, and work in progress.
 |
 |
Power BI Project Reporting for Business Central
Track project performance through one consistent reporting model. As a result, interactive dashboards help project and finance teams monitor delivery, compare actual results with budgets and identify projects that need attention.
What You Can Analyze
More than 100 measures and over 20 dimensions provide a detailed view of project performance.
- Project overview and comparison analysis
- Project profitability
- Actual results versus budget
- Recognized general ledger amounts versus budget
- Gantt charts and project schedules
- Resource and item profitability
- Project WIP and revenue recognition
- Outstanding purchase orders affecting projects
- Project ledger entries and planning lines
Users can begin with the full project portfolio and then drill through to individual projects, tasks, planning lines and ledger entries.
Keep Delivery and Financial Performance Aligned
Compare progress, costs, budgets and profitability throughout the project lifecycle. For example, actual-versus-budget analysis highlights projects that require attention before a variance grows. Gantt charts and resource analysis connect financial results with project delivery. Teams can review schedules, workloads, resources and outstanding purchase orders together. As a result, project reviews can address both operational and commercial performance.
Improve Project Control and Profitability
Understand which projects, customers, resources and items generate value. In addition, project managers can compare profitability across the portfolio and investigate the factors affecting individual results. This visibility supports better project planning and earlier intervention. It also helps teams keep delivery decisions aligned with financial goals.
Manage WIP and Revenue Recognition
Work-in-progress and revenue-recognition reports give finance teams a clearer view of project accounting. Users can monitor recognized amounts, compare them with budgets and investigate unexpected results. When further detail is needed, teams can move from portfolio-level measures to project tasks, planning lines and ledger entries. This gives project managers and finance teams a shared basis for reviews and reconciliations.
Multi-Company and Flexible Analysis
Bring project information from multiple Business Central companies into one reporting view. Users can then filter and compare results by company, customer, project, project task, resource, item, date and other relevant dimensions. At the same time, the consolidated view preserves access to individual companies, projects and source transactions.
Reporting Without Custom Development
The ready-to-use Power BI app connects directly to Microsoft Dynamics 365 Business Central. This means project and finance teams can start with proven reports instead of building every dashboard from scratch. Teams can also use the underlying semantic model to create additional Power BI reports or analyze trusted Business Central data in Microsoft Excel. In this way, the app provides a flexible reporting foundation without requiring extensive custom development.
Explore Projects Insights
Learn more about , review current , or book a tailored .
Ready to explore your own Business Central project data? Start a .
Submit your review | |