

|
Sales Insights for Dynamics 365 BCPower BI Sales Reporting for Dynamics 365 BC |
Product Verticals: All Industries
Business Processes: Business Intelligence, Financial Reporting, Reporting, Sales and Marketing, Sales Order Processing
Sales Insights gives Microsoft Dynamics 365 Business Central users 50+ ready-to-use Power BI reports. In addition, teams can increase revenue visibility, improve customer service, and make faster decisions.
 |
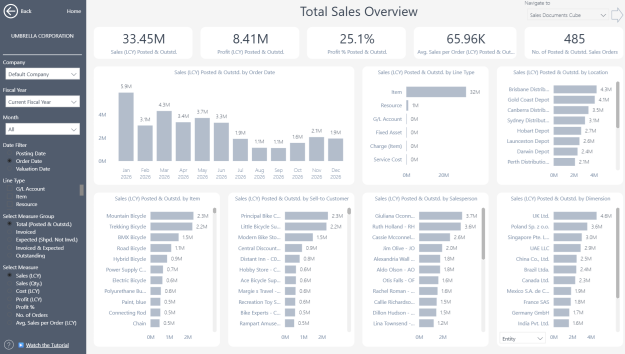 |
Power BI Sales Reporting for Business Central
Start with ready-to-use reports covering revenue, profit, customers, items, salespeople, delivery performance and outstanding orders. As a result, your team can replace disconnected spreadsheets with one consistent reporting solution.
What You Can Analyze with Sales Insights
More than 350 measures and over 30 dimensions provide a detailed view of sales and delivery performance.
- Revenue, profit, margins and sales trends
- Customers and products driving growth
- Performance across different reporting periods
- Sales by salesperson, location, customer and item
- New and lost customers
- On-time delivery and fill rates
- Sales orders and outstanding commitments
- Detailed sales transactions
Ready-to-use reports include Total Sales Overview, Daily Sales Analysis, Sales by Customer, Sales by Item, Delivery Analytics and Outstanding Sales Orders. When further investigation is needed, users can drill through to the underlying Business Central entries.
Understand Customer and Product Performance
Analyze buying patterns, customer growth and profitability. Sales leaders can identify growing accounts, declining customers and changes in purchasing behavior before deciding where to focus. Product analysis also shows which items and categories drive revenue, profit and demand. Consequently, teams can make commercial decisions using a clearer view of customer and product performance.
Connect Sales with Delivery Performance
Delivery analysis links commercial results with customer service and operational execution. Teams can monitor on-time delivery and fill rates while identifying the customers, items or locations behind poor performance. This helps managers understand whether late deliveries or low fulfillment rates may affect revenue and customer relationships. It also provides consistent information for conversations between sales and operational teams.
Turn Sales Data into Commercial Action
Compare revenue, profit, customers, items and salespeople in one reporting experience. For example, managers can identify changing trends, emerging opportunities and areas where performance requires attention. Users can move from headline indicators to detailed transactions. Therefore, sales reviews can focus on evidence, priorities and action instead of manually reconciling separate spreadsheets.
Multi-Company and Flexible Analysis
Bring sales information from multiple Business Central companies into one reporting view. Users can then filter and compare results by company, customer, salesperson, item, item category, location, resource, period and other Business Central dimensions. At the same time, the consolidated view preserves access to individual companies and source transactions.
Sales Reporting Without Custom Development
Sales Insights connects directly to Microsoft Dynamics 365 Business Central. This means sales, finance and operational teams can start with proven reports instead of building every dashboard from scratch. Teams can also use the underlying semantic model to create additional Power BI reports or analyze trusted Business Central data in Microsoft Excel. In this way, the app provides a flexible reporting foundation without the time, cost and maintenance requirements of a full custom data warehouse.
Explore Sales Insights
Learn more about , review current , or book a tailored .
Ready to explore your own Business Central sales data? Start a .
Submit your review | |