

|
Finance Insights for Dynamics 365 BCPower BI Finance Reporting for Business Central |
Product Verticals: All Industries
Business Processes: Accounting, Budgeting, Business Intelligence, Financial Management, Financial Reporting, Multicurrency, Reporting
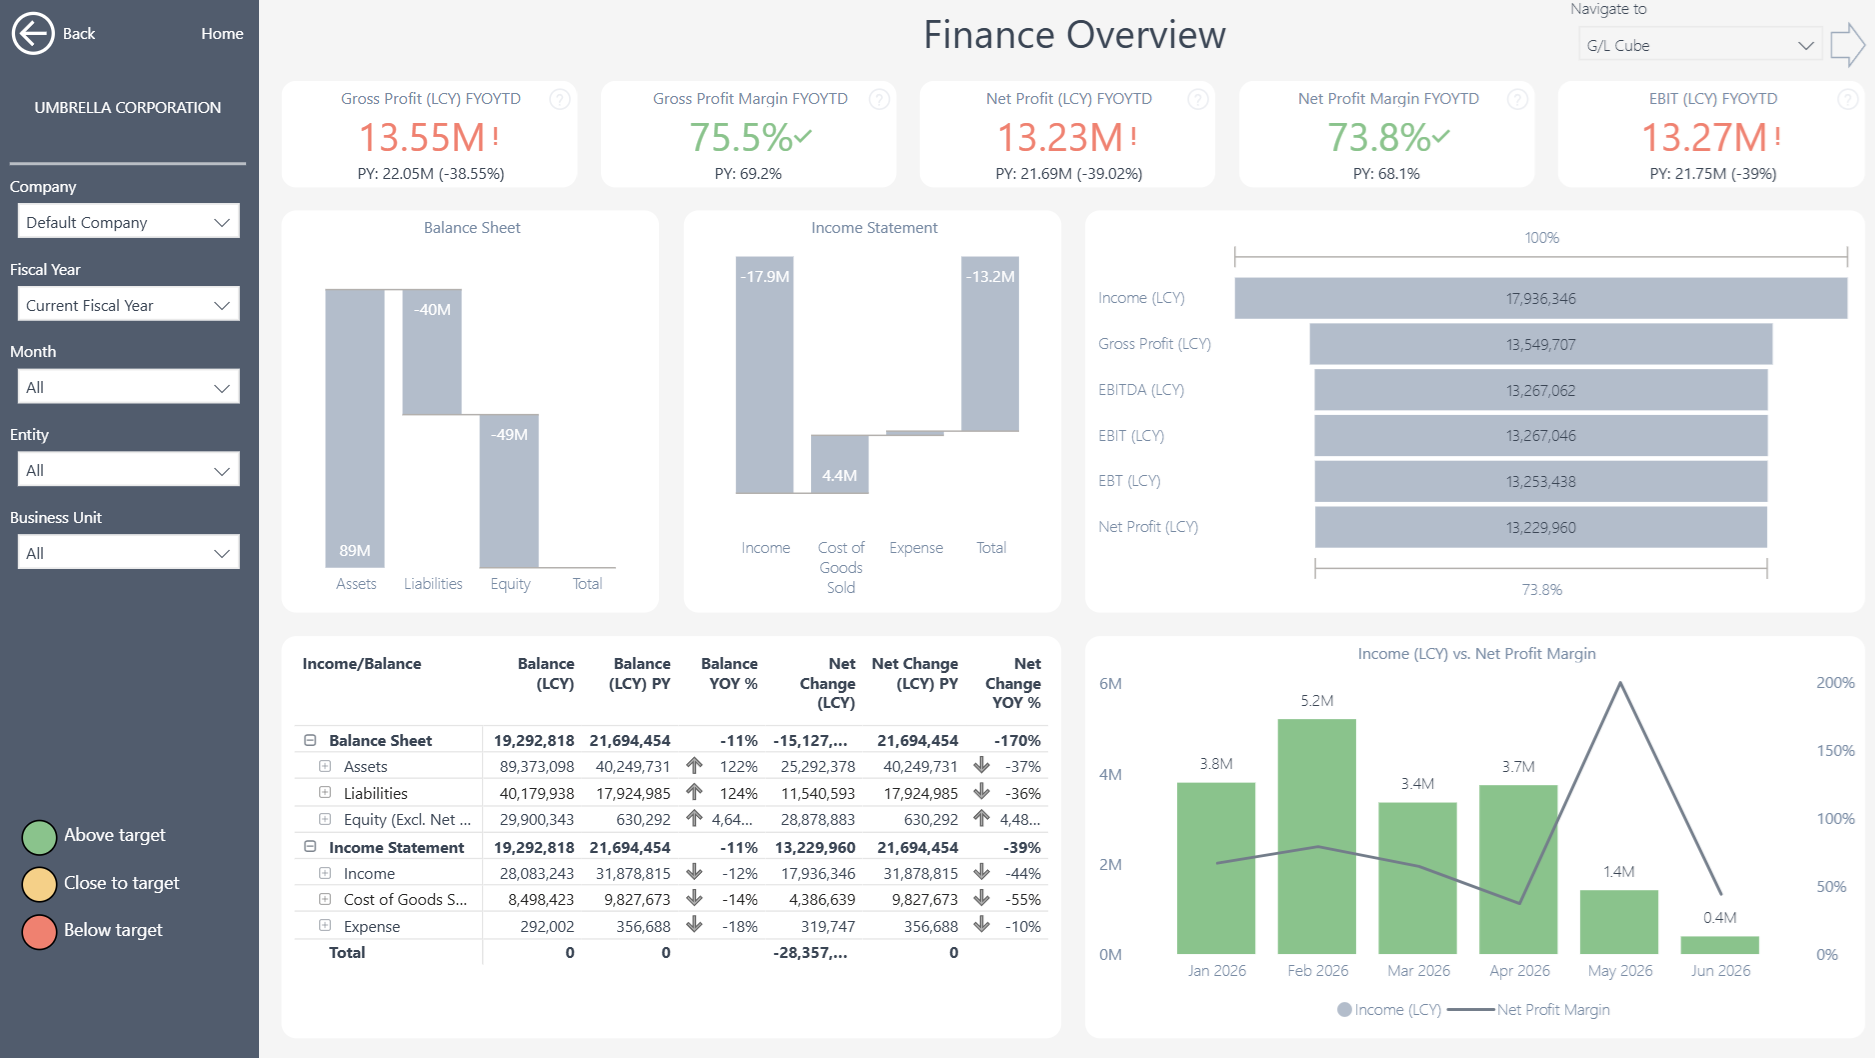
Finance Insights gives Microsoft Dynamics 365 Business Central users 35+ ready-to-use Power BI finance reports. It helps finance teams replace disconnected spreadsheets, investigate results faster, and make better-informed decisions.
 |
 |
Power BI Finance Reporting for Business Central
Start with ready-to-use reports covering financial statements, budgets, account analysis, ratios and transaction-level detail. As a result, finance teams gain one consistent reporting solution for routine reviews and deeper analysis.
What You Can Analyze with Finance Insights
More than 150 measures and over 20 dimensions provide a detailed view of financial position and performance.
- Interactive Balance Sheets and Income Statements
- Actual performance compared with budgets
- Revenue, expenses, margins and profitability
- Liquidity, activity, leverage and profitability ratios
- Results across companies, periods and dimensions
- Accounts and business areas driving financial change
- Supporting G/L entries and transaction-level detail
Ready-to-use reports include Finance Overview, Chart of Accounts, Balance Sheet, Assets, Liabilities and Equity, Income Statement, Income and Expenses, budget analysis and financial ratios.
Multi-Company and Multi-Currency Financial Reporting
Bring financial results from different Business Central companies into one reporting view. Users can then filter and compare data by G/L account, account category, fixed asset, company, department, location and other Business Central dimensions. Multi-currency analysis also presents results in local and reporting currencies. At the same time, the consolidated view preserves access to individual companies and source transactions.
Use Existing Business Central Financial Structures
Finance Insights works with the Financial Reports and G/L Account Categories maintained in Business Central. Therefore, finance teams can continue managing row definitions, account groupings and financial layouts within the system they already use. The app brings these structures into Power BI as interactive reports. This reduces reliance on developers and helps keep reporting aligned as the organization evolves.
Move from Summary Figures to Transaction Detail
Interactive dashboards and dimensional analysis help users investigate financial change. For example, a user can begin with a high-level result and identify the accounts, companies or departments behind it. In addition, transaction-level drill-through then provides the supporting G/L entries. This makes it easier to investigate variances, answer audit questions and understand the factors behind financial performance.
Support Faster Financial Reviews
Finance leaders can use the dashboards during month-end reviews, management reporting and performance meetings. For instance, they can compare actual results with budgets before investigating the accounts, departments or companies behind each variance. Consequently, teams spend less time reconciling separate spreadsheets. Instead, they can focus on the decisions and actions behind the numbers.
Flexible Financial Reporting Without Custom Development
Finance Insights connects directly to Microsoft Dynamics 365 Business Central. This means finance teams can start with proven reports instead of building every dashboard from scratch. Teams can also use the underlying semantic model to create additional Power BI reports or analyze trusted Business Central data in Microsoft Excel. In this way, the app provides a flexible reporting foundation without the time, cost and maintenance requirements of a full custom data warehouse.
Explore Finance Insights
Learn more about , review current , or book a tailored .
Ready to explore your own Business Central financial data? Start a .
Submit your review | |